


Most Americans have money in the stock market. Most of the money in the stock market, however, belongs to a relatively small group of Americans.
According to Gallup’s stock ownership data, 58% of U.S. adults owned stock in April 2026, either directly, through a stock mutual fund, or through a self-directed retirement account such as a 401(k) or IRA. That is down from 62% in 2025, but still comfortably above half the country.
Then there is the other number.
Federal Reserve data for the second quarter of 2026 shows that the wealthiest 1% of households held 50.9% of all corporate equities and mutual fund shares in the Fed’s Distributional Financial Accounts. In dollar terms, that comes to about $32.9 trillion, based on the latest Federal Reserve wealth figures.
Both statements can be true. America has built a remarkably broad investing culture.
Millions of ordinary workers participate in markets through retirement plans and investment accounts. Ownership of the actual dollars invested remains extraordinarily concentrated.
The Top 1% Holds About $32.9 Trillion
The numbers become even more striking when you see just how much of America’s stock market wealth is concentrated at the very top.
The video below, The Top 1% Own Half of All US Stocks by Money Behind Numbers, offers a visual look at the enormous gap between ordinary investors and the wealthiest Americans.
The Federal Reserve breaks household wealth into five groups.
Its latest numbers show roughly $64.6 trillion in corporate equities and mutual fund shares distributed across the wealth spectrum, according to the Distributional Financial Accounts.
| Wealth group | Holdings | Share of total |
|---|---|---|
| Top 0.1% | $16.15 trillion | 25.0% |
| Next 0.9% | $16.74 trillion | 25.9% |
| Next 9% | $24.01 trillion | 37.1% |
| 50th–90th percentile | $7.36 trillion | 11.4% |
| Bottom 50% | $0.37 trillion | 0.6% |
Add the first two groups together, and the top 1% owns about 50.9%. Expand the group to the richest 10%, and the share reaches roughly 88%. The bottom half of the wealth distribution owns less than 1%.
It can be difficult to find a clearer illustration of the difference between being in the stock market and owning a meaningful portion of it.
Someone with $4,000 in a 401(k) and someone with $40 million in equities both count as stock owners. Statistically, each adds one person to the ownership rate. Financially, they occupy different planets.
Owning Stock Is Not the Same as Owning Much Stock
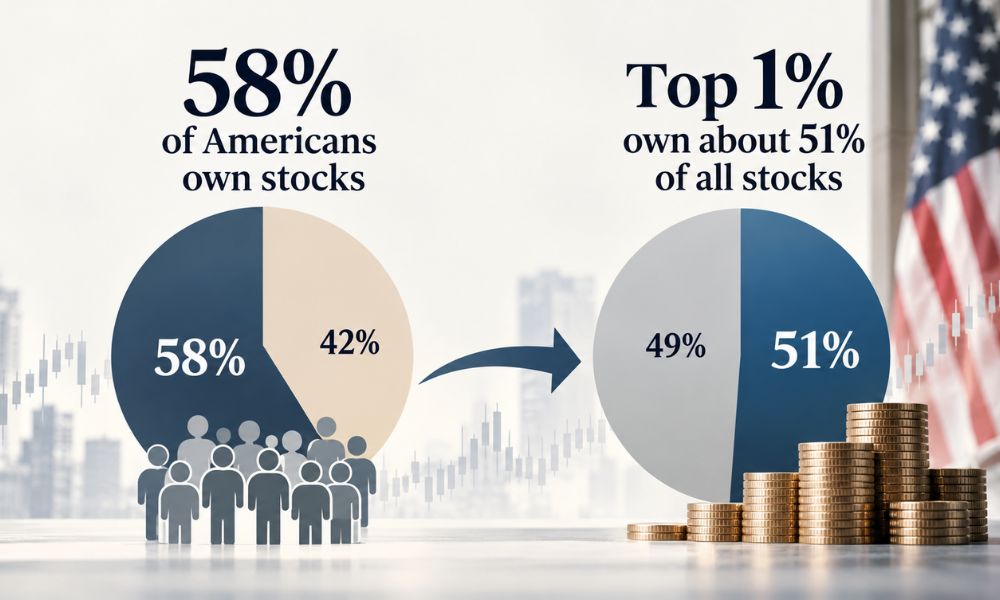
Gallup’s 58% figure is useful because it tells us how widespread market participation has become. However, it does not tell us how much everyone owns.
The Federal Reserve’s Survey of Consumer Finances gives us a better look at that distinction. In 2022, 58% of families held stock directly or indirectly, but participation varied sharply with income.
Only 34% of families in the bottom half of the usual-income distribution owned stock, compared with 78% in the next 40% and 95% in the top income decile, according to the Survey of Consumer Finances.
The gap becomes much larger when we look at account values.
Among families that owned stock, the median holding in 2022 was:
- $12,600 for the bottom half by income
- $53,200 for the 50th through 89.9th percentiles
- $608,000 for the top income decile
That last figure is nearly 50 times the first. Participation matters, but the amounts matter more.
A financial system can have millions of investors and still deliver the overwhelming majority of market gains to households that already own large portfolios. That is exactly what the numbers describe.
Market Gains Naturally Produce Unequal Dollar Gains
Suppose the stock market rises 10%. An investor with $10,000 gains $1,000. An investor with $100,000 gains $10,000. Someone with $5 million invested gains $500,000.
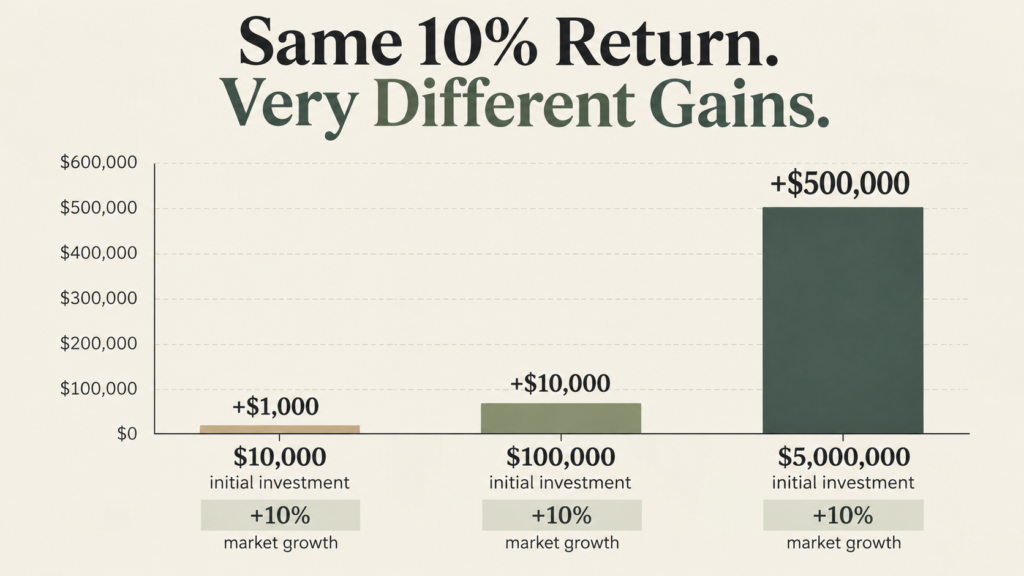
Nobody received a better percentage return. The larger portfolio simply had more capital working. Run that process repeatedly over many years, and the differences become enormous.
It’s doubtful that this makes investing somehow unfair. Compound growth is doing exactly what the arithmetic says it should do. The uncomfortable part is what happens before the compounding begins.
People with high incomes have more room to save. People who already own assets receive larger dollar gains when asset prices rise. Those gains become additional capital that can remain invested. The next market increase then works on a larger base.
Why does owning more capital make such a difference over time? The video below, The Rich Own 53% of America’s Stock Market. Here’s Why., explores how investment returns, compound growth, and access to capital help explain the concentration of stock market wealth in the United States. It also shows why earning a salary and owning appreciating assets can lead to very different financial outcomes.
Money is very efficient at reproducing itself once there is enough of it. That helps explain another recent statistic we wrote about. The United States added more than 440,000 dollar millionaires in 2025, and the millionaire boom was largely ownership.
A strong market does much more for someone entering the year with $900,000 in assets than for someone starting with $9,000. Same market. Very different financial consequence.
Stock Ownership Has Become Broader

There is good news in the participation numbers, and no one should dismiss it.
Stock ownership used to be far more closely associated with wealthy individuals buying shares through brokers. Retirement accounts, index funds, workplace plans, and low-cost brokerage platforms have brought market exposure to a much larger share of the population.
Even after falling to 58% in 2026, stock ownership remains above the 52% readings Gallup recorded in 2013 and 2016.
Direct stock ownership has expanded too. The Fed found that 21% of families directly owned stocks in 2022, up from 15% in 2019. The median amount among direct stock owners actually fell from $29,000 to $15,000, which is consistent with newer investors entering with smaller portfolios.
That can be seen as progress. Owning $2,000 is better than owning zero if the goal is to participate in long-term economic growth. Everybody has to start somewhere, and almost nobody begins with a seven-figure brokerage account.
Still, we should not confuse wider access with equal ownership.
America has democratized the ability to buy stocks much faster than it has democratized the amount of capital people have available to invest.
The Top 1% Share Has Not Moved in a Straight Line
We should also resist turning one statistic into a simplistic story about wealth concentration constantly moving in one direction. Federal Reserve data goes back to 1989.
The top 1% owned 42.8% of corporate equities and mutual fund shares in the third quarter of that year. The share moved above 50% during the mid-1990s, fell substantially after the technology bubble, climbed again, and reached 52.3% during parts of 2019.
It then dropped as low as 49.3% in 2022 before climbing to 50.9% in the second quarter of 2026.
So no, the chart is not a perfectly straight line pointing upward.
Asset prices move. Different groups hold different mixes of assets. Market cycles change valuations. Household behavior changes.
The longer-term comparison is still striking. The top 1% owned about 43% of this asset category when the series began. Today they own about 51%.
That is a meaningful shift when the underlying pool is measured in tens of trillions of dollars.
At the Very Top, Ownership Gets Enormous
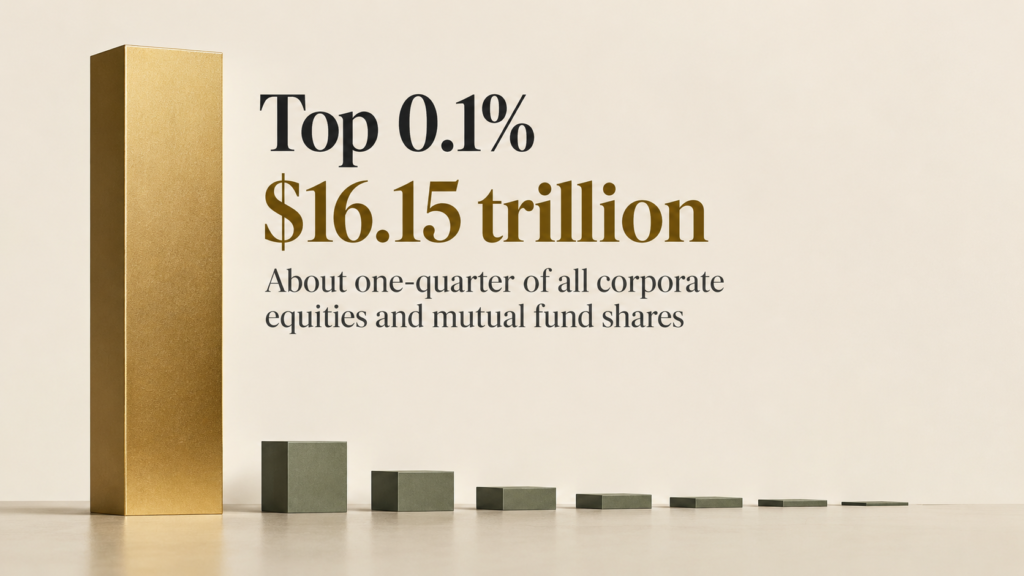
The concentration becomes easier to understand when looking at individual fortunes.
The top 0.1% alone holds about $16.15 trillion in corporate equities and mutual fund shares according to the latest Fed figures. That is roughly one-quarter of the entire category.
Recent billionaire data provides an extreme version of the same phenomenon. When the Forbes 400 cutoff reached $4.4 billion, fortunes tied to technology companies and other appreciating assets showed how quickly enormous pools of ownership can grow when valuations rise.
For someone whose wealth comes primarily from wages, a booming stock market is something happening in the financial news.
For someone who owns a large portion of a business, the same boom can alter net worth by hundreds of millions of dollars.
Ownership is the transmission mechanism.
There Is an Important Catch in the “Half the Stock” Claim
An asterisk should be put beside any statement that simply says the richest 1% owns half of “the stock market.”
As the Fed explains in its financial instrument definitions, the category used here is specifically corporate equities and mutual fund shares. Corporate equities include ownership in corporate businesses, and mutual funds can hold different combinations of assets.
There is another complication.
Defined-contribution pension entitlements appear separately in the Distributional Financial Accounts, even though retirement plans can themselves contain substantial stock exposure.
Some hedge-fund and private-debt-fund holdings also remained inside the corporate-equity and mutual-fund category in the second-quarter 2026 data, according to the Fed’s DFA release notes.
So 50.9% should not be interpreted as the top 1% literally owning 50.9% of every publicly traded share in America.
The cleaner statement is that the top 1% owns 50.9% of the Fed’s household corporate-equity and mutual-fund wealth category.
Still a remarkable number. Just a more accurate one.
Broad Participation Is Only Half the Story
Think about this. It is likely that people would rather live in a country where 58% of adults have exposure to stocks than one where the market is available only to a small wealthy class.
Broad participation gives ordinary households a way to benefit when businesses grow, profits rise, and markets compound over decades.
The weakness is that participation alone does not tell us much about financial power.
The bottom half of households can collectively own less than 1% of this enormous pool of financial assets even as millions of them technically qualify as investors.
The imbalance extends far beyond stock ownership. According to the latest Federal Reserve figures, the richest 1% now control 32.5% of US household wealth, showing how deeply concentrated the country’s accumulated assets have become.
That distinction matters whenever we hear that a rising stock market is making “Americans” richer.
It is. Just not by remotely equal amounts.
A worker whose retirement account gains $3,000 has become wealthier. A household whose portfolio gains $3 million has also become wealthier. Putting both into the same sentence without mentioning the scale hides more than it explains.
That is what you should take from the numbers. America has succeeded at getting a majority of its population into the market.
The harder problem is helping more of those people accumulate enough capital for market returns to materially change their financial lives.
Owning stock opens the door. How much you own determines how much of the upside actually comes through it.